On this page
Core Web Vitals in 2026: What Actually Moves Rankings
Technical reference for Core Web Vitals in 2026. Analyzes CrUX field data measurement, LCP critical paths, INP attribution with the LoAF API, and search ranking impact.
Who Should Read This
This guide is written for frontend performance developers, technical SEOs, and software architects. It assumes familiarity with the browser rendering pipeline and focuses strictly on what actually drives search rankings in 2026, bypassing basic “optimize your images” advice in favor of deep-dives into Field data, the LoAF API, and server-side rendering bottlenecks.
Reference Card: 2026 Thresholds
- LCP (Largest Contentful Paint)
- Good: ≤ 2.5s | Needs Improvement: ≤ 4.0s | Poor: > 4.0s
- INP ([Interaction to Next Paint](/blog/demystifying-inp-optimization/))
- Good: ≤ 200ms | Needs Improvement: ≤ 500ms | Poor: > 500ms
- CLS (Cumulative Layout Shift)
- Good: ≤ 0.1 | Needs Improvement: ≤ 0.25 | Poor: > 0.25
- Ranking Impact
- One of many ranking signals / baseline threshold. Evaluated based on 28-day Field data.
- Field Measurement
- CrUX (Chrome User Experience Report),
web-vitals.js, RUM - Lab Measurement
- Lighthouse, WebPageTest, Chrome DevTools
- Last verified
- August 2026 — Verified against Google Search Central and web.dev specs
Key takeaways
- Core Web Vitals are one of many ranking signals. Passing CWV acts as a positive threshold, but content relevance always takes priority.
- Google's page experience evaluation is based on field data from CrUX, rather than Lighthouse scores.
- On server-rendered and CDN-backed sites, Time to First Byte (TTFB) is frequently the dominant contributor to LCP failures.
- Interaction to Next Paint (INP) is heavily impacted by JavaScript hydration and third-party scripts; diagnosing it requires the Long Animation Frames (LoAF) API.
- Cumulative Layout Shift (CLS) remains a risk on mobile devices, specifically from runtime-generated ad insertions, late-injected embeds, and web fonts.
1. Ranking Impact and The CrUX Window
Google’s algorithm treats Core Web Vitals (CWV) primarily as a baseline threshold and one of many ranking signals. While a perfect score will not overcome thin or irrelevant content, passing the CWV assessment acts as a positive signal when evaluating competing pages of similar relevance.
Crucially, the data Google uses for rankings is completely detached from the tools most developers use during local development.
Field Data vs. Lab Data
Google’s page experience evaluation is based on Field data, collected from real users via the Chrome User Experience Report (CrUX). Lab data, such as a Lighthouse audit run in Chrome DevTools or CI/CD pipelines, operates in a simulated environment.
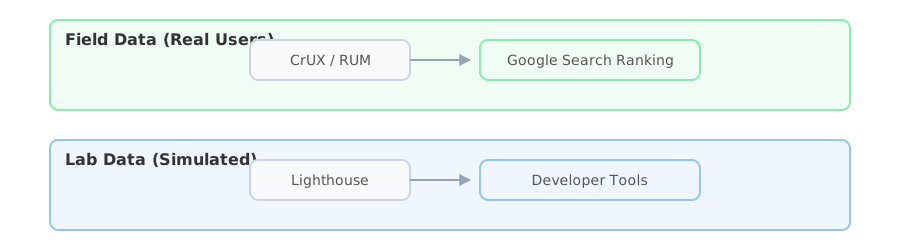
A 100/100 Lighthouse score does not guarantee a rankings boost if real users on slow mobile networks fail the 2.5s LCP threshold. Conversely, a poor Lighthouse score does not penalize rankings if your real-world user base is on fast connections and passes the CrUX metrics.
The 28-Day Window and Grouping
Because CrUX uses a rolling 28-day dataset, improvements generally take several weeks to fully replace older data in Search Console.
Also, Google groups CWV data:
- URL-level: If a specific URL receives enough traffic, Google assigns CWV scores to that exact page.
- Origin-level: If a URL lacks sufficient traffic to generate statistically significant data, Google applies the aggregate origin (site-wide) score to that URL.
- Device-level: Scores are strictly separated by device. It is incredibly common for a site to easily pass Desktop thresholds while severely failing Mobile thresholds due to slower mobile CPUs and constrained networks. You must optimize for the mobile baseline.
Technical SEO Rule: Stop optimizing for a 100/100 Lighthouse score. Optimize for the 75th percentile of your real users using RUM (Real User Monitoring) tools or CrUX data.
2. Measurement and Attribution
To reliably improve CWV, you must bridge the gap between Field telemetry (what users experience) and Lab diagnostics (why it happens).
Real User Monitoring (RUM)
RUM platforms utilize Google’s official web-vitals library. This library hooks into browser Performance APIs (PerformanceObserver) to capture exact LCP, INP, and CLS events from live user sessions.
You can capture this telemetry yourself using a PerformanceObserver:
import { onLCP, onINP, onCLS } from 'web-vitals';

// Send metrics to your analytics endpoint
onLCP((metric) => {
  console.log('LCP Value:', metric.value);
  console.log('LCP Element:', metric.entries[0].element); // Attribution!
});

onINP(console.log);
onCLS(console.log);
When deploying web-vitals.js, you must capture attribution data:
- Which specific DOM element triggered the LCP?
- Which specific element shifted to cause CLS?
- Which interaction type (click, keydown) triggered the INP?
Without attribution data, a RUM dashboard showing a 600ms INP is useless for development, as you will not know which React component or button caused the delay.
3. Largest Contentful Paint (LCP): The Full Critical Path
LCP measures when the largest text block or image element is rendered. Developers often misdiagnose LCP failures by obsessing solely over image compression, ignoring the four-part critical path:
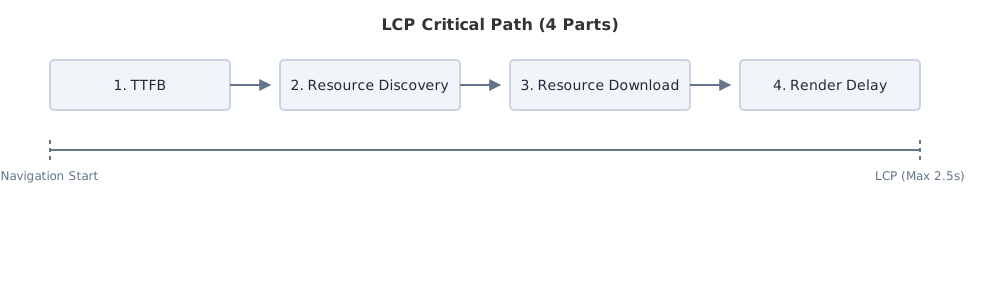
- Time to First Byte (TTFB): The time from the request starting to the first byte of the HTML response.
- Resource Load Delay: The time between TTFB and the browser initiating the fetch for the LCP resource.
- Resource Load Time: The network time to download the LCP resource.
- Element Render Delay: The time between the resource finishing its download and the browser rendering it on screen.
When TTFB Dominates LCP
On server-rendered (SSR) applications and CDN-backed sites, TTFB is frequently the dominant contributor to LCP failures. Note that TTFB is not just your database query; it is:
Backend Processing + CDN Routing + Network Latency
If this entire chain takes 1.5 seconds, your LCP is mathematically impossible to get under 1.5 seconds, regardless of image size.
The Fix:
- Implement Stale-While-Revalidate caching at the CDN edge.
- Stream SSR responses so the
<head>arrives instantly while the body continues rendering.
Optimizing Resource Load Delay
If the LCP element is an image, the browser must discover it. If the <img> is injected via JavaScript (client-side rendering) or hidden in a CSS background-image, the Resource Load Delay will be massive because the preload scanner cannot find it in the initial HTML byte stream. Common pitfalls also include poorly configured responsive images where the browser downloads the wrong size first.
The Fix:
- Add
fetchpriority="high"to the LCP<img>tag to elevate it in the browser’s download queue. - Use
<picture>orsrcsetcorrectly to ensure the browser fetches the optimal asset size. - If the server think-time is high, use HTTP 103 Early Hints to transmit a
Link: rel=preloadheader while the server is still processing the document.
4. Interaction to Next Paint (INP): The JavaScript Bottleneck
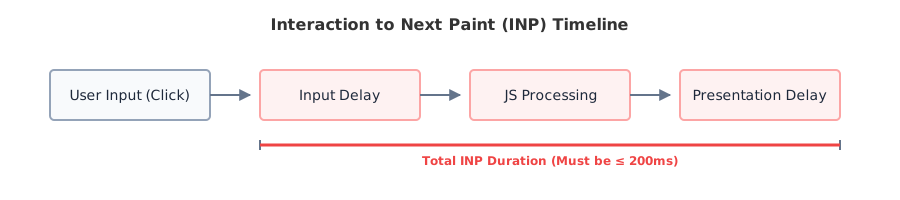
INP is the strictest of the three metrics. It measures the entire latency from a user’s interaction (e.g., a click) to the moment the browser is able to paint the next visual frame.
Why INP Fails
INP failures occur when the browser’s main thread is blocked by a “long task” (JavaScript execution exceeding 50ms).
- Massive Hydration: Single Page Applications executing heavy hydration logic immediately after load.
- Third-Party Scripts: Tag managers, ads, and analytics monopolizing the main thread.
- Synchronous DOM Updates: Client-side rendering forcing massive synchronous layout recalculations.
Attribution: LoAF vs. Long Tasks API
Diagnosing INP in the field requires the Long Animation Frames (LoAF) API. Developers often confuse LoAF with the older Long Tasks API.
| API | Purpose & Capability |
|---|---|
| Long Tasks API | Simply identifies that the main thread was blocked for > 50ms. Cannot easily point to which script caused the blockage. |
| LoAF (Long Animation Frames) | Exposes exactly which third-party script, UI component, or function caused the blocked thread. Essential for INP attribution. |
The PerformanceLongAnimationFrameTiming interface provides detailed telemetry, exposing the exact third-party script or application bundle responsible for the failure.
The Fix: Yielding to the Main Thread
You must break up monolithic JavaScript execution. Third-party scripts should be deferred using async/defer, or moved entirely off the main thread using Web Workers (e.g., Partytown). For first-party code, the scheduler.yield() API allows developers to pause heavy execution, let the browser process user input and paint the screen, and then resume.
Because browser support for scheduler.yield() is not yet universal, it should be treated as a progressive enhancement, falling back to setTimeout(resolve, 0) or scheduler.postTask on older browser engines.
5. Cumulative Layout Shift (CLS): Not Fully Solved
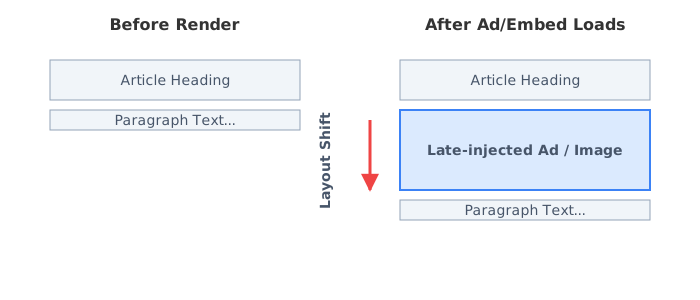
While modern CSS features like aspect-ratio and explicit width/height attributes on images have resolved the easiest layout shifts, CLS remains a persistent issue for publishers, news sites, and highly variable applications.
Remaining CLS Risks
- Runtime-generated Ad Insertion: Client-side scripts injecting ad banners above the fold after the text has rendered.
- Late-Injected Embeds: Social media embeds expanding to unknown heights.
- Web Fonts (FOIT/FOUT): The text flashing unstyled and shifting layout when the custom font finally loads.
Advanced Mitigation
- CSS
content-visibility: For heavy, complex layouts off-screen, usingcontent-visibility: autocan skip rendering work until the element scrolls into view, preventing massive re-layouts. - Font Tuning: While
font-display: optionalprevents layout shifts by abandoning the custom font on slow connections, it can result in users never seeing your brand typography. To mitigate font shifts without hiding text, utilize CSSsize-adjustandfont-size-adjust. By mathematically matching the bounding box of your fallback font (e.g., Arial) to your custom web font, the text will not shift when the custom font swaps in.
6. Crawl Budget and Rendering Architecture
While Core Web Vitals measure user experience, heavy JavaScript also directly impacts your SEO crawl budget.
Googlebot executes JavaScript to render pages when needed, but this is computationally expensive. URLs reliant entirely on Client-Side Rendering (CSR) can delay rendering and indexing depending on rendering complexity. This means new content might take days to appear in search results because it was placed in a secondary rendering queue.
The Verdict: Server-Side Rendering (SSR) or Static Site Generation (SSG) generally provide the most predictable SEO outcomes for content-heavy sites. The HTML document returned to Googlebot must contain the critical text content, structured data, and internal links without requiring a JavaScript engine to boot.
7. Common Myths
| Myth | Reality |
|---|---|
| A 100 Lighthouse score guarantees a #1 ranking. | False. Google uses Field data (CrUX), not Lighthouse scores, for ranking. |
| Early Hints improves TTFB. | False. It improves LCP by using server think-time productively, but doesn’t reduce TTFB. |
CLS is solved by adding width and height to images. | False. Web fonts, ads, and late UI injection remain major CLS drivers. |
| Desktop CWV is enough. | False. Google separates Mobile and Desktop scores. You must optimize for Mobile constraints. |
| CWV is the biggest ranking factor. | False. It is one of many ranking signals. Content relevance is always the primary factor. |
8. Glossary
- CrUX (Chrome User Experience Report): Google’s dataset of real-world user experience metrics, used as the official source for CWV ranking signals.
- RUM (Real User Monitoring): Telemetry tools (like
web-vitals.js) that collect performance data from actual visitors rather than lab simulations. - TTFB (Time to First Byte): The time from the start of the request to the arrival of the first byte of the HTML response (Backend + CDN + Network).
- LoAF (Long Animation Frames): A modern browser API that attributes INP failures to specific long-running JavaScript tasks.
- Hydration: The process where a Client-Side JavaScript framework attaches event listeners and state to server-rendered HTML.
- SSR (Server-Side Rendering): Generating the full HTML document on the server before sending it to the client.
- CSR (Client-Side Rendering): Sending a blank HTML shell and relying on JavaScript to render the page content in the browser.
- SSG (Static Site Generation): Generating HTML at build time, resulting in static files served instantly from a CDN.
9. Frequently Asked Questions
Is a 100/100 Lighthouse score required to rank #1?
No. Google uses 28-day Field data (CrUX), not Lighthouse lab scores, for ranking. An 80/100 Lighthouse score that reliably passes the 2.5s LCP threshold for real users on mobile devices is entirely sufficient for SEO.
Why does my Search Console show “Poor” URLs when Lighthouse is green?
Your real users are experiencing slower networks or devices than the simulated Lighthouse environment. Implement web-vitals.js to capture Field telemetry to understand what actual users are seeing.
Does Early Hints improve TTFB?
No. HTTP 103 Early Hints makes the browser’s waiting time productive by downloading resources during server think-time, improving LCP. It does not reduce the TTFB of the final HTML document.
How often does the CrUX data update?
The Chrome User Experience Report provides a rolling 28-day average. It updates daily in Search Console, but it will always reflect the previous 28 days of traffic.
References and Specifications
- Understanding Core Web Vitals (Google Search Central)
- Chrome User Experience Report (CrUX) Documentation
- Long Animation Frames (LoAF) API Specification
- web-vitals.js Library

Written by
Platform Engineer and Technical Writer with 10+ years of full-stack development experience and 2+ years focused on DevOps and platform engineering.